MEP Scenario planning modules
We have an exciting development: the Maritime Emissions Portal (MEP). The scenario Planning module is live on the MEP platform. This module aims to transform how ports derive insights from MEP emission evaluations and analyse the effects of their port infrastructure changes on their total emissions.
Significant enhancement
Until now, the MEP allowed users to calculate ship-based emissions and identify emissions hotspots in their ports and terminals. However, our customers requested more significant analytical insights into what actions and investments could resolve said hotspots and reduce port emissions. We have heard your feedback and developed the tools to help you successfully model emissions reduction strategies at your port.
Introducing the Scenario Planning Module:
With the Scenario Planning module, we’re introducing an advanced tool to help users get more specific data insight, create and justify business cases around infrastructure developments and upgrades, and identify particular berths or vessel types where their focus should be towards improving port operations. Here is a glimpse of what the scenario planning module holds:
Scenario Planning page:
All scenario modules host various scenarios that can help to reduce port emissions. Currently, it includes two modules.
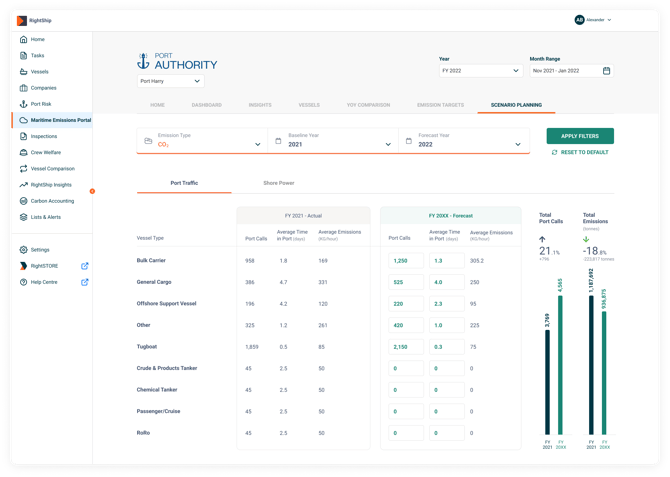
Port Traffic Module:
This module will help users identify the average time and emissions in port spent by each vessel type for a reference year for which data is available. Based on this, users can update their expected increase in port call volumes due to business enhancement and average time reductions due to port traffic management, such as optimised operations or opening new terminals, etc., for a forecast year. The results will give them insight into the increase or reduction in port emissions for the forecast year.

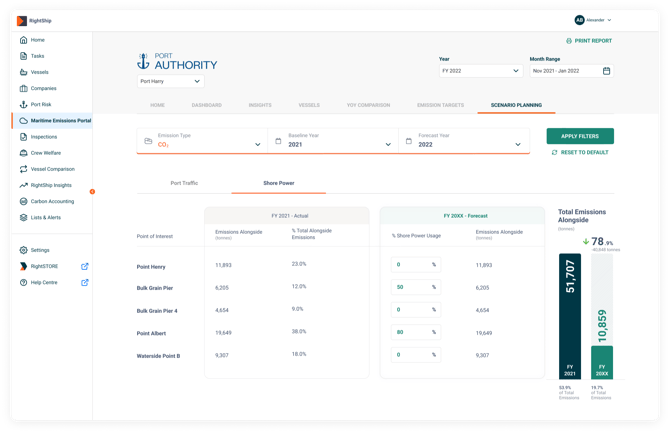
Shore Power module:
This module focuses on the alongside emissions. It will help users identify the berth/ terminals where most emissions occur. A gap we have identified through user behaviour and thought process is that the berth/ terminal where the highest volume of vessel calls happens might be instinctively judged as the centre of any shore power infrastructure development. However, from our experiences studying MEP data, we have seen that it often needs to be corrected, and the hotspot needs to be noticed somewhere else. Additionally, alongside emissions, in most cases, comprise up to 50% of a port’s total emissions. While it may look like shore power is merely shifting emissions from vessels alongside the inland thermal power plant and thus has no impact on global carbon dioxide reduction, it is not so. Inland power plants can be more efficient and use fuels with lower carbon emission factors, such as LNG or nuclear. Hence, developing shore power infrastructure is a win-win situation for the port, its country and global decarbonisation. Users can enter the % usage factor if their shore power infrastructure is developed at a particular berth/ terminal hotspot by a future year and see the impact on emissions reductions, port call volumes and average time in port remaining the same.

Watch this feature guide to learn more.
We will continue to work on scenarios modules, feel free to reach out to our sustainability team with any suggestions, we will evaluate them and see if they can be incorporated into future releases.
FAQs
-
Q. Are the results of these modules absolute?
A. The module studies reference years' data and extrapolates it to forecast year-based customer input. All calculations will happen once the forecast year arrives according to the MEP methodology and port operational conditions present.
-
Q. Would existing customers have to pay to upgrade to MEP Enterprise?
A. No, all existing MEP users will get this module too.