Benchmark progress and compare a baseline year with up to three comparison years (for GHG and/or criteria pollutants). The page is available when you have emissions data for more than one year.
What is included.
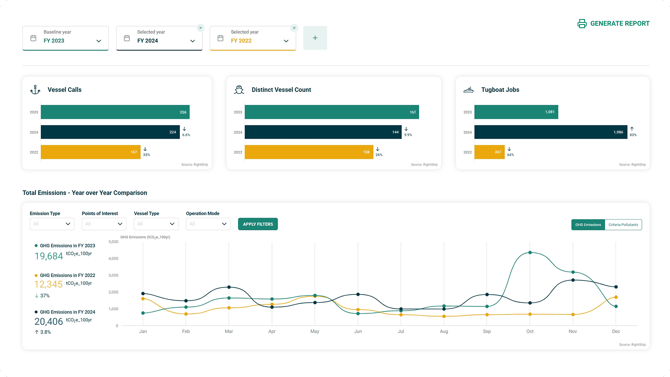
- Filters: Vessel Type, Emission Type, POI, and Operation Mode – press ‘Apply Filters’.
- Metrics: YoY vessel headline statistics by year (Vessel Calls, Distinct Vessels, Tugboat Jobs) and below that, monthly Emissions line graph, with GHG emission values per year expressed as tCO₂e_100yr with % changes.
This page helps distinguish year‑to‑year seasonal emissions patterns from the effects of structural changes at a port, enabling the impact of interventions to be assessed and used to inform strategy.