This page provides a deeper, visual analysis to spot outliers, providing further opportunity to see the impact of absolute emissions and identify where the port can most effectively optimise its decarbonisation plans and air quality. It does this by comparing performance to targets, and understand influencing factors across vessel segments, scopes, modes, size classes, and age.
- Filters - Switch ‘Emission Type’ from default (CO₂) to any required emission type. In addition, ’Filter by’ allows filtering by vessel type, scope, operation mode, GHG Rating (see ‘GHG Help section’), DWT, and age.
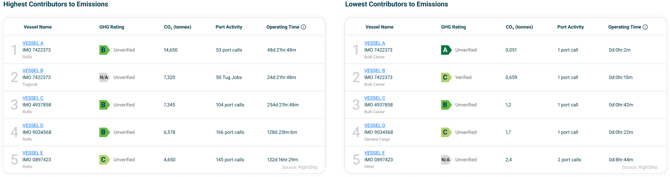
- Highest & lowest contributors to emissions (top 5 of each): for each category find vessel names/IMOs/types, GHG Ratings, emissions, port activity, and operating times.
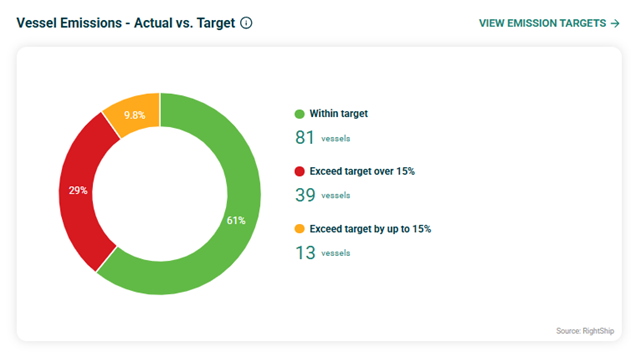
- Vessel Emissions — Actual vs Target - utilises a traffic light system that shows share of vessels meeting target (green), ≤15% over (amber), and >15% over (red). See ‘Emissions Targets’ for filtering of traffic light system. The amber target % can be toggled on the “Emissions Targets” page.
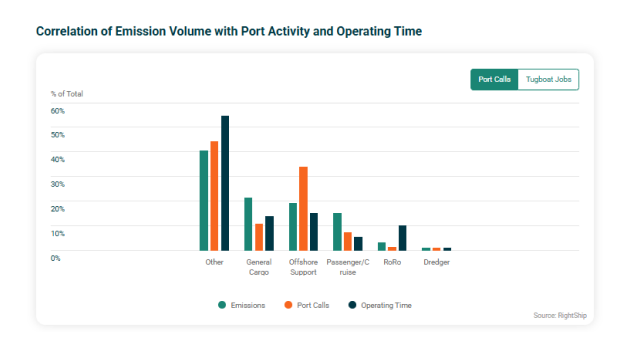
- Correlation analysis: toggle between “Port Calls” and “Tugboat Jobs,” where a ‘port calls’ is when a OGV vessel enters and leaves the port boundary and a ‘tugboat job’ is when a tugboat leaves and enters tugboat pen to do active work in a port.
- “Port Calls” - examines proportionality between emissions, port call activity, and operating time by vessel type – with highest emitters starting on the left; highlights anomalies (incl. a specific tugboat‑jobs view).
- Emissions by month: this details actual vs target emissions by month for the selected period allowing a comparison through the year for emissions. Hovering over a month provides a tonnage number for that specific emission. Additionally, there is a link to the “View Emissions Target” page.

- Long‑term Forecast visualises short‑ and long‑term target forecasting pathways, comparing actuals to target trajectory and IMO‑aligned requirements to aid investment planning. Additionally, target dates can be edited on the “View Emission Target” page.
